Telemetry, Rebuilt
See everything, export what matters
Every binary execution, every rename, link, unlink, clone, every fork, screen unlock, gatekeeper override — Santa sees it all.

For many years, Santa has generated an incredibly rich stream of endpoint activity telemetry, data that most organizations would love to have in their security tooling. Every binary execution, every rename, link, unlink, clone, every fork, screen unlock, gatekeeper override — Santa sees it all.
Yet this capability hasn’t been widely known or utilized. One of the reasons for this is that Santa’s telemetry has been locked away in protobuf logs on disk or a much less detailed text format, difficult to aggregate across a fleet and nearly impossible to query at scale. Organizations running Santa on thousands of hosts have been sitting on a goldmine of security data without a pickaxe.
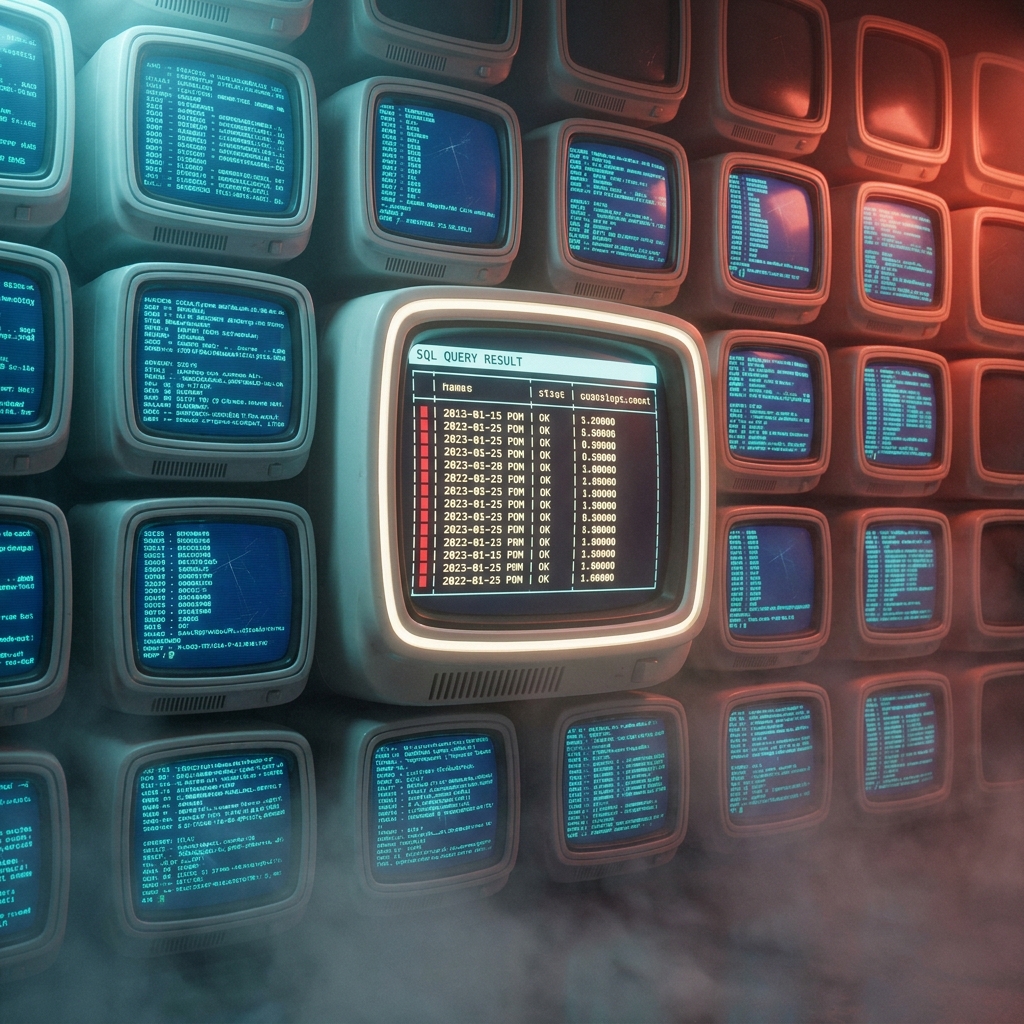
Workshop 2026.2 changes that. The new telemetry export pipeline ships events in Parquet format directly to a cloud storage bucket — S3 or GCS. Parquet is columnar, compressed, and natively supported by virtually every data platform and query engine. Your telemetry goes from opaque protobuf logs on individual hosts to structured, queryable data directly in Workshop.
You don’t even need to bring your own query engine: Workshop includes a built-in query interface that lets you search and analyze your telemetry using SQL, right from the Workshop UI (or API, if you prefer!). Filter by host, user, signing ID, time range — whatever you need to investigate an incident or understand what’s happening across your fleet.
But we didn’t stop at just making the existing telemetry exportable & queryable. The 2026.2 release also introduces two features we’re particularly proud of: telemetry filtering and network flow telemetry.
Telemetry Filtering with CEL
Having access to all of this telemetry is great but you want to focus on the events that are important, not the benign. Some processes execute thousands of times a day and generate telemetry that’s purely noise. Others contain sensitive information — command-line arguments with API keys, environment variables with database credentials — that you don’t want landing in a data lake where your entire security team (or a third-party SIEM vendor) can see it.
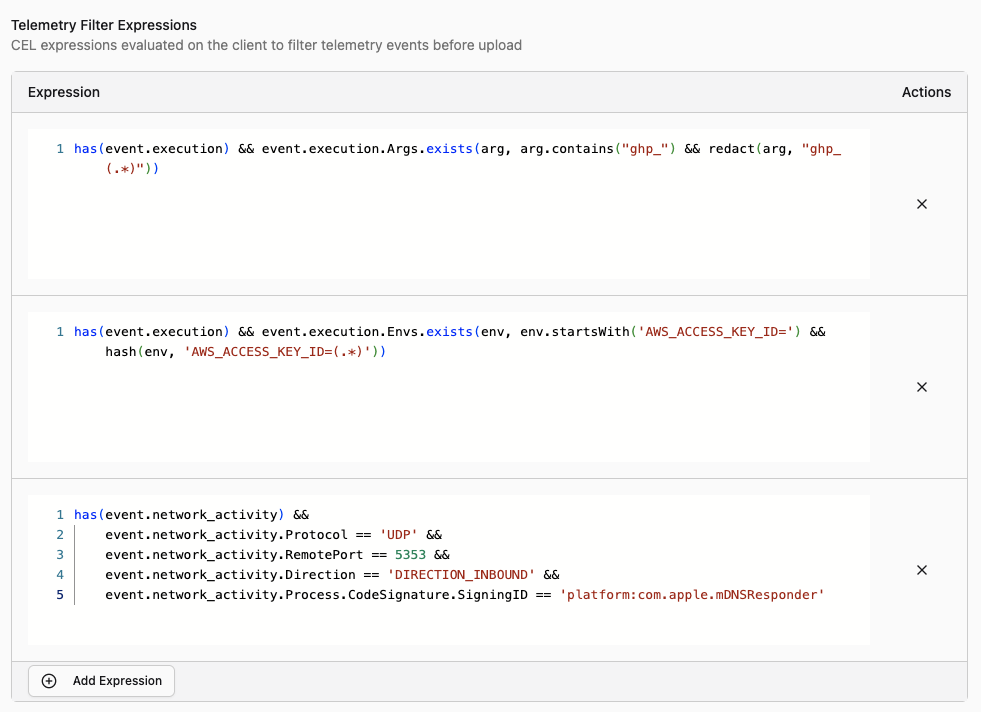
Telemetry filtering lets you write CEL (Common Expression Language) expressions that are evaluated against each event before it’s exported. You can do two things with them:
Drop events entirely. If an event matches your filter expression, it’s silently discarded and never exported. This is useful for cutting out noise — if you know that /usr/libexec/syspolicyd executes hundreds of times a day and you don’t need that telemetry, drop it:
has(event.execution) &&
event.execution.Target.IsPlatformBinary &&
event.execution.Target.CodeSignature.SigningID ==
      "com.apple.syspolicyd"
Any event matching this expression won’t be exported, reducing storage costs & network transfers, improving query performance, and reducing noise from your queries.
Redact sensitive strings. Instead of dropping the whole event, you can redact specific values from fields like command-line arguments and environment variables. If your developers frequently pass API tokens on the command line, you can scrub them before export:
has(event.execution) &&
event.execution.Args.exists(arg, arg.contains("ghp_") &&
    redact(arg, "ghp_(.*)")
)
When a redaction filter matches, Workshop replaces the sensitive value with a redacted placeholder. The event is still exported with all its other useful context — which process, which host, which user, when it ran — but the secret itself never leaves the machine.
You can configure telemetry filters per tag in Workshop, so different parts of your fleet can have different filtering policies. Your engineering team might need aggressive redaction of environment variables, while the rest of your fleet might just need noise reduction. You can also configure telemetry filters in the Santa configuration provided by your MDM.
Network Flow Telemetry
Santa 2026.2 introduces a new network extension that monitors socket-level network activity on the host. This is the first telemetry event type covering network activity, and it gives security teams visibility into which processes are making network connections and where they’re connecting to.
For each network flow, Santa records:
- Process information: the binary path, signing ID, team ID, and user that initiated the connection
- Source and destination: IP addresses and ports for both ends of the connection
- Protocol: TCP, UDP, or other protocol identifiers
- Data volume: bytes sent and received over the lifetime of the flow
This means you can answer questions that were previously difficult or impossible without a separate network monitoring tool: Which processes on a host are communicating with external IP addresses? Are your hosts connecting to any known-bad IPs? How much data did a process exfiltrate before it was blocked? Which hosts have processes phoning home to unexpected destinations?
Network flow events go through the same export pipeline as all other telemetry, which means they also benefit from telemetry filtering. If you have chatty network services that generate thousands of flows per minute, you can filter them out. If outbound connections contain sensitive destination information that needs to be restricted to a subset of your team, you can redact it.
How It Works
The network extension runs alongside Santa’s system extension on the host. When a process opens a socket, Santa’s network extension observes the flow and collects metadata about it. Once the flow completes (or at periodic intervals for long-lived connections), Santa packages the flow data into a telemetry event and sends it to Workshop during its normal sync cycle.
Because this is implemented as a macOS network extension, it has visibility into all socket-level activity — not just HTTP traffic, but any TCP or UDP communication. This includes things like DNS lookups, SSH connections, database client connections, and anything else that opens a socket.
Workshop processes these events just like execution events and file access events: they’re stored for querying in the Workshop UI and exported to your configured cloud storage buckets.
Getting Started
Telemetry filtering and network flow telemetry are available in Santa and Workshop 2026.2. If you’re already a Workshop customer, update your instance and get in touch with us to enable telemetry export.
If you’re new to Workshop, contact us to see the new telemetry capabilities in action. We’d love to show you how telemetry filtering and network visibility fit into your security workflow.
You may also like

Introducing AI Chat for Workshop
Workshop now ships an AI chat that answers natural-language questions about hosts, rules, events, and policies. Bring your own LLM API key.

Announcing Touch ID for Santa
Santa now supports Touch ID verification before execution, so CEL rules can require a biometric check for sensitive operations like remote debugging.

Announcing Santa & Workshop 2026.6
Santa and Workshop 2026.6 add network rules, privilege management, Signals, webhooks, a redesigned Ready for Lockdown report, and more